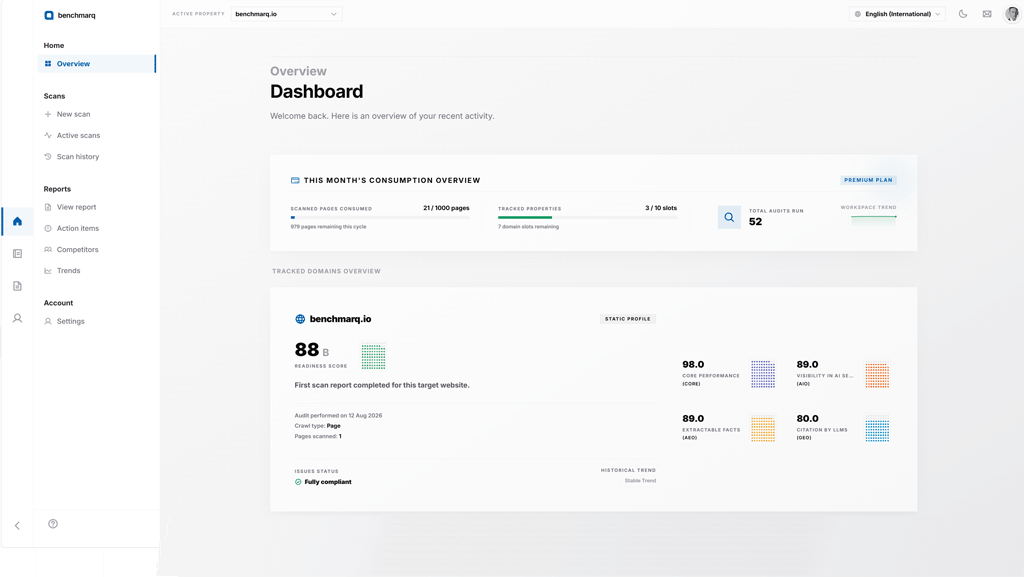
Read a report.How to read a Benchmarq report.
Benchmarq reports break down your site's readiness into a composite benchmark score, four track ratings (GEO, AEO, AIO, CORE), and prioritized code-level fixes ordered by severity.
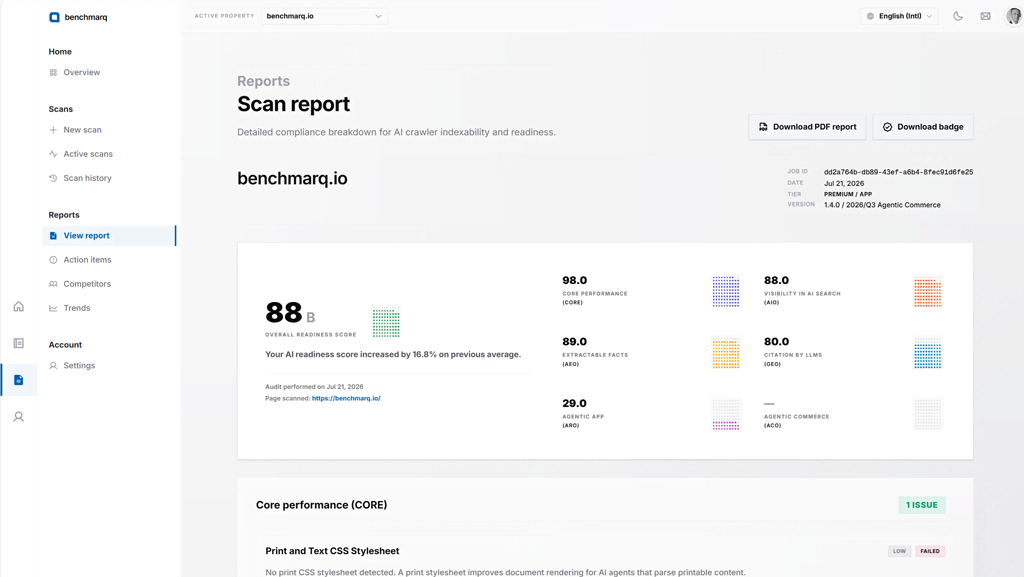
2. Inspect composite score and track matrix
The report header summarizes your overall AI readiness score (0-100) alongside individual breakdown cards for GEO, AEO, AIO, and CORE.
Each track score isolates specific machine behaviors: GEO reflects citation confidence in LLMs, AEO evaluates direct-answer extraction, AIO validates agentic crawler accessibility, and CORE measures foundational semantic markup and HTTP headers.
3. Drill into prioritized issues and code fixes
Expand any track to review passed checks, warnings, and critical errors. Each issue contains a technical root cause explanation and exact remediation instructions (e.g. JSON-LD schema diffs, robots.txt directives, or cache header tuning).
Filter findings by impact severity or affected page URLs to triage development backlog items efficiently.